hotstepper.Steps.plot
-
Steps.plot(method=None, smooth_factor=None, smooth_basis=None, interval=0.01, ax=None, where='post', **kargs)¶ Plot the steps function using different parameters and methods.
- Parameters
method ({'function','smooth','pretty','smooth_function', Optional}) – Specify how the steps should be calculated to generate the plot and the type of plot style.
smooth_factor (int, float, Optional) – If using the method=’smooth’ option, set the strength of the smoothing to apply.
smooth_basis (Basis, Optional) – The :class: Basis to use when calculating the smooth steps function.
interval (int, float, Pandas.Timedetla, Optional) – If using method = ‘function’ or ‘smooth’, specify the increment size between step key locations used to calculate the steps function.
ax (Matplotlib.Axes, Optional) – The axes to plot this chart onto is already defined.
where ({'pre', 'post', Optional}) – How to draw the step plot, this parameter is the same as the Matplotlib where parameter used in the Axes.step plotting function.
**kargs – Matplotlib key-value arguments
- Returns
A reference to the plot axes object to allow further plotting on the same axes.
- Return type
Matplotlib.Axes
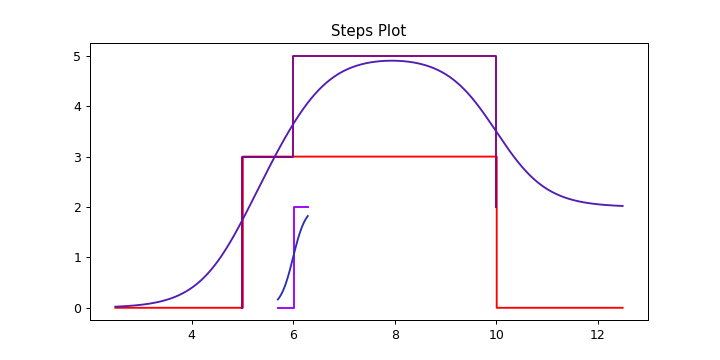
Examples
s1 = Step(5,10,3)
s2 = Step(6,weight=2)
st = s1 + s2
ax = s1.plot(color='r',figsize=(8,4))
s2.plot(ax=ax,method='function')
s2.plot(ax=ax,method='smooth')
st.plot(ax=ax)
st.smooth_plot(ax=ax)

ax.set_title('Steps Plot')